The Report Designer allows you to create and edit page-based Report Templates which can generate output from your Projects in all sorts of advanced and powerful ways. This section of Help covers a wide range of topics to transform your Project data into meaningful insights.
Your report templates contain 'controls', like TextBox, Table, List etc, which can display hard-coded values, e.g. a title or label, or they can display values provided by a dataset. Your reports in Stardraw Design 7.4 will commonly use data provided by the Products, Cables, Drawing, Project and User datasets.
The datasets contain Attribute values and, potentially, other data entered in your project so, for example, the Products dataset contains the values entered for all of the Attributes belonging to all of the Products in your Project.
Certain controls in your report template deliver data regions; these enumerate the members of the dataset and return values as required. The controls that deliver data regions are Table, Tablix, List and Banded List so if, for example, you bind a Table to the Products dataset, it will return a row for each Product in your Project and the columns in that Table can return the value of any Attribute belonging to the Product.
Data regions allow you to manage data, e.g.
The controls in your report also allow you to operate on data in very powerful ways e.g.
In short, Reporting lets you analyse and present the data stored in your project in almost any way imaginable.
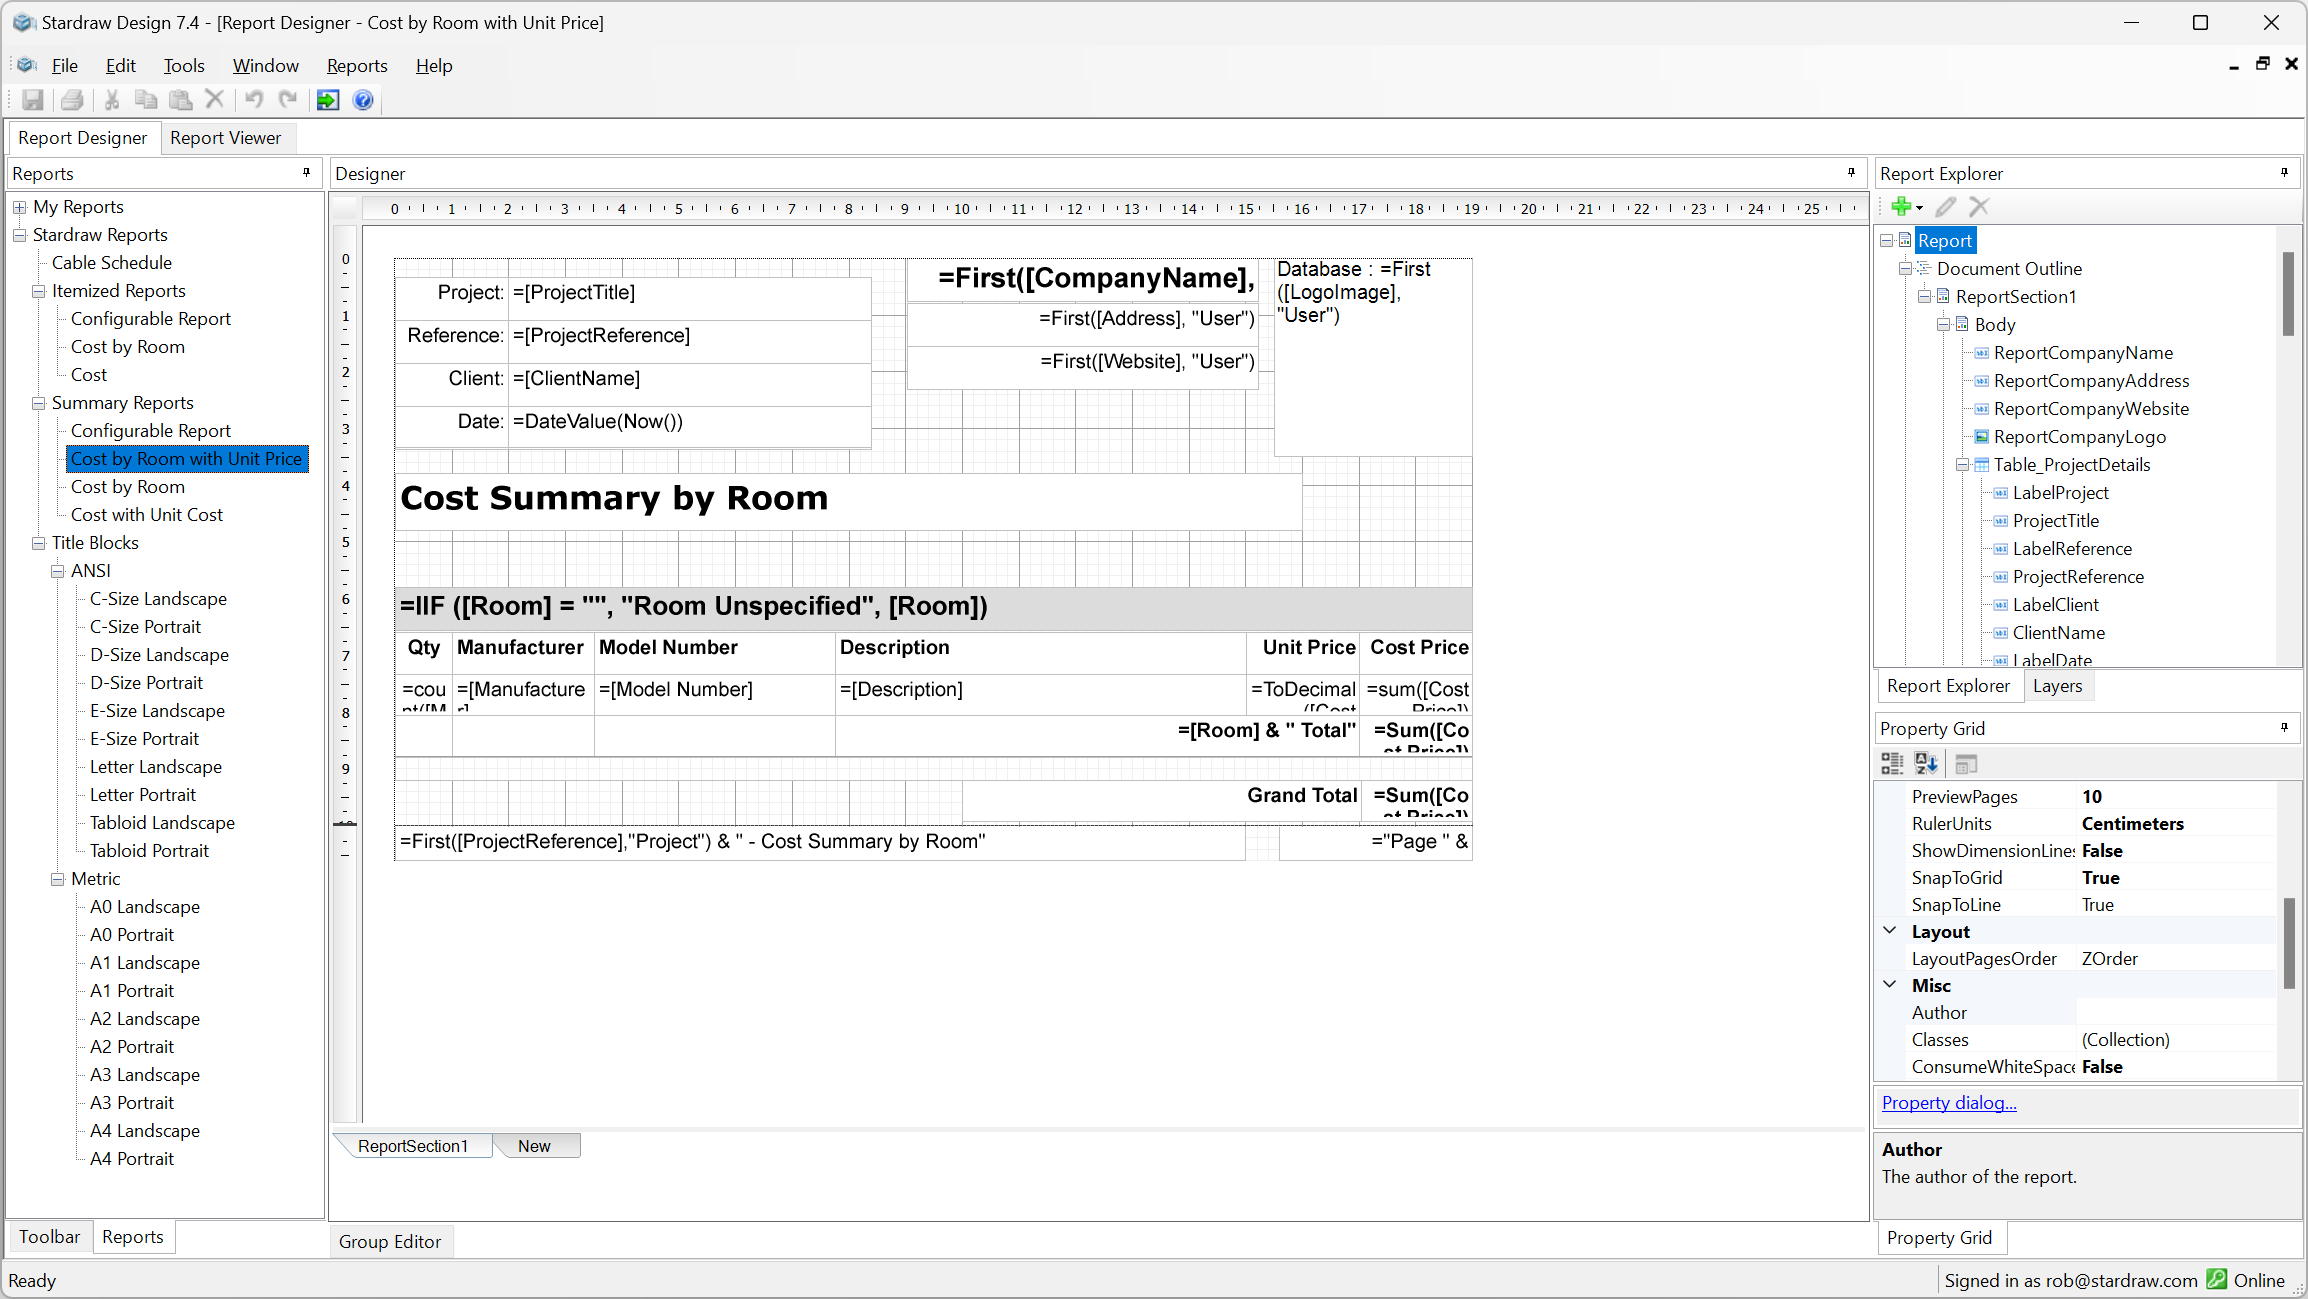
The Report Designer interface consists of the following regions:
On the left of your screen, the Reports Browser shows report templates provided by Stardraw Design 7.4 under the Stardraw Reports root, and user-defined report templates under My Reports. Select any report template to open it for editing in the Report Designer.
You cannot save changes to the default Stardraw Reports so, if you want to use a modified version of a Stardraw Report template you should choose Reports | Save As and save the modified template so that it appears under My Reports.
To the right of the Reports Browser, the Toolbox contains tools and report items used to create report templates. By default the Toolbox displays icons but you can expand it using the 'hamburger' menu at the top left, to see item names.
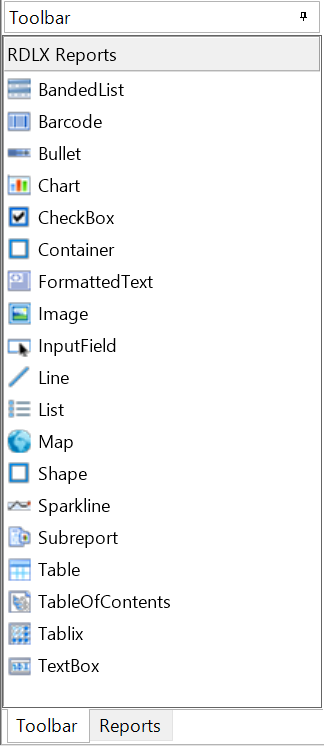
Doubleclick on, or click and drag a control to place it in the report template.
Follow the links below for full details on report controls:
The Properties Grid is located on the right-hand side of your screen and displays the properties of the selected report element. If more than one element is selected, only their common properties are shown.
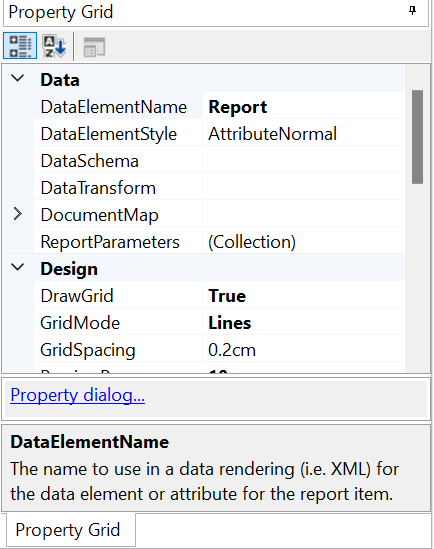
Use the Property Grid to set values for individual properties and behaviors of the selected object(s).
The Data Listing is located on the right-hand side of your screen and is the tab next to the Properties Grid. It displays datasets and common values available for use in your report.
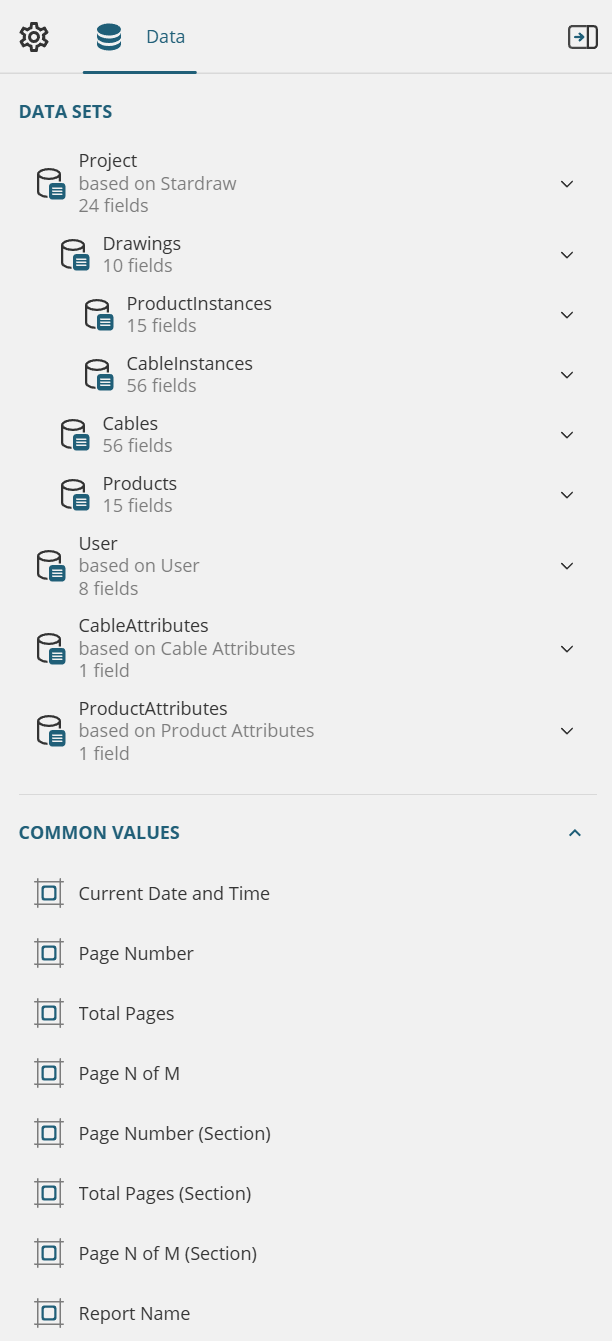
Use the Property Grid to set values for individual properties and behaviors of the selected object(s).
Click on the Preview button to view a preview of the report template being edited, populated with data from the current Project.
Learn the different types of layout options for your reports.
Learn about the features available through report dialog in reports.
Learn about layers that can overlay with other groups of controls on a report.
Learn about expressions that you can use in reports.
Learn about filters in reports,
Learn about grouping data in reports,
Learn about the features in reports that support interactive capabilities.
Learn about customizing the appearance of reports.