In the Report Designer you can use an expression to set the value of a control in the report, or set conditions under which certain styles apply. You can define expressions in:
All expressions begin with an equal sign (=) and use the same syntax as Microsoft Visual Basic® .NET. For example, the expression for a field value for a TextBox is set as follows:
=Fields!Room.Value
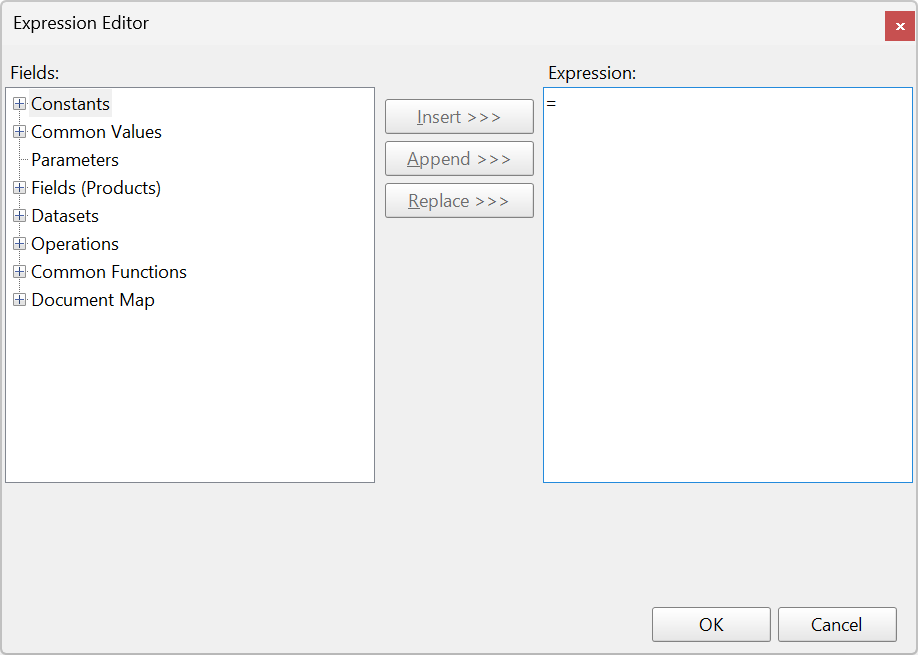
You can build expressions quickly using the Expression Editor dialog. This dialog allows you to choose from a number of fields available to the report as well as to a particular property.
You can access the Expression Editor by selecting nearly any property of a control and choosing <Expression...> from the drop-down list.
There are the following types of fields available in the Expression Editor:
The Expression Editor dialog is composed of two panes, Fields and Expression.
The expression appears as the property value in the properties grid.
In its raw form, your data may not be ideally suited for display in a report. You can customize and manipulate data to make it perform and display in ways that suit your needs using expressions. Following are some examples of how expressions are set in different scenarios.
You can concatenate fields with strings and with other fields. For example, use the following expression to get a result that reads "System: Auditorium - Audio System".
="System: " & Fields!Room.Value & " - " & Fields!System.Value & " System"
This example takes the hardcoded string "System: ", adds (or 'concatenates') the value of the Room field, then adds another string " - ", then the value of the System field, then finishes with the string " System"
You can use expressions in properties like Color, Font, Border etc. to return different values based on a condition e.g. to highlight a part of your data. The formula for conditional formatting is:
=iif( Fields!YourFieldName.Value operator "Value to compare", "use this value if true", "use this value if false")
For example, if you enter the following expression in the Font > FontWeight property of a textbox that displays information about a product, you will get bold text if the product's Type Attribute has the value "New".
=iif(Fields!Type.Value = "New", "Bold", "Normal")
You can use a number of aggregate and other functions in your expressions. The Report Designer includes a range of functions, including running value, population standard variance, standard deviation, count, minimum and maximum. For example, use the following expression to get a count of products with the same Model Number.
=Count(Fields.Item("Model Number").Value)
As you design the report, the full text of an expression can get very long. The Report Designer makes expressions easier to read by shortening them.
When an expression is in the form:
=Fields!<FieldName>.Value
On the design surface, you will see this text inside the control:
=[<FieldName>]
Double-click the control to view the full expression in edit mode.
The same applies to aggregates: when the Expression value is:
=<Aggregate>(Fields!<FieldName>.Value)
On the design surface, you will see:
=<Aggregate>([<FieldName>])
Using the example to count the number of products with the same Model Number you would therefore see:
=Count([Model Number])
This shortened expression is only a visual change to allow you to read expressions more easily. The shorthand display is used both in controls, e.g. a TextBox, on the design surface and any dropdown boxes inside dialogs.
Besides the shorthand for field names, you can also type shorthand like [@Param] for parameters and [&Value] for Globals such as [&PageNumber] on the design surface.
Common Values are run time values available to every property in every report. You can directly drag and drop these common values from the Report Explorer onto the design surface or add and modify the values from the Expression Editor. Following is a list of the values that you can see under the Common Values node in the Report Explorer and in the Expression Editor.
| Value | Description | Expression |
|---|---|---|
| Page N of M | Gets both the current page and the total number of pages in the report. |
="Page " & Globals!PageNumber & " of" & Globals!TotalPages |
| Page N of M (Section) | Gets both the current page and the total number of pages in the report section. |
="Page " & Globals!PageNumberInSection & " of " & Globals!TotalPagesInSection |
| Page N of M (Cumulative) | Gets both the current page and the total number of cumulative pages in a report. |
="Page " & Globals!CumulativePageNumber & " of " & Globals!CumulativeTotalPages |
| Current Date and Time | Gets the date and time when the report began to run. |
=Globals!ExecutionTime |
| User ID | Gets the machine name/user name of the current user. |
=User!UserID |
| Page Number | Gets the current page number in the report. |
=Globals!PageNumber |
| Page Number (Section) | Gets the current page number in the report section. |
=Globals!PageNumberInSection |
| Total Pages | Gets the total number of pages in the report. |
=Globals!TotalPages |
| Total Pages (Section) | Gets the total number of pages in the report section. |
=Globals!TotalPagesInSection |
| Cumulative Page Number | Gets the current cumulative page number. |
=Globals!CumulativePageNumber |
| Cumulative Total Pages | Gets the total number of cumulative pages in the report. |
=Globals!CumulativeTotalPages |
| Report Folder | Gets the name of the folder containing the report. |
=Globals!ReportFolder |
| Report Name | Gets the name of the report. |
=Globals!ReportName |
| User Language | Gets the language settings of the current user. |
=User!Language |
You can use a function in an expression to perform actions on data in data regions, groups and datasets. You can access these functions in the Expression Editor dialog. In any property that accepts expressions, you can drop down the property and select <Expression...> to open the dialog.
Within the Expression Editor dialog, there is a tree view of Fields. Expand the Common Functions node to view the available functions. The following tables contain details about each of the functions included in the Report Designer for use in property expressions.
These are all methods from the DateAndTime class in Visual Basic. Please see msdn DateAndTime Class topic for information on overloads for each method.
These are all the available aggregate functions:
| Function | Description | Syntax and Example |
|---|---|---|
| DateAdd | Returns a date and time value that is the result of adding the interval to the date and time field of the specified unit. | DateAdd(<DateInterval>,<Number>,<DateTime>)
=DateAdd("d", 5, Fields!SaleDate.Value); =DateAdd(DateInterval.Day, 5, Fields!SaleDate.Value) |
| DateDiff | Returns the difference between the start date and time and end date and time of the specified unit. | DateDiff(<DateInterval>,<DateTime1>,<DateTime2>[,<DayOfWeek>[,WeekOfYear]]))
=DateDiff("yyyy"), Fields!SaleDate.Value,"1/1/2015");=DateDiff(DateInterval.Year,Fields!SaleDate.Value,"1/1/2015") |
| DatePart | Returns the Integer value that represents the specified part of the given date. | DatePart(<DateInterval>,<DateTime1>[,<FirstDayOfWeek>[,FirstWeekOfYear]]))
=DatePart("m", Fields!SaleDate.Value) |
| DateSerial | Returns a Date value that represents a specified year, month, and a day, with the time information set to midnight (00:00:00). | DateSerial(<Year Number>,<Month Number>,<Day Number>)
=DateSerial(DatePart("yyyy", Fields!SaleDate.Value)-10, DatePart("m", Fields!SaleDate.Value)+5, DatePart("d", Fields!SaleDate.Value)-1) |
| DateString | Returns the String value that represents the current date in your system. | DateString()
=DateString() |
| DateValue | Returns a Date value that contains the information on date represented by a string, with the time set to midnight (00:00:00). | DateValue(<StringDate>)
=DateValue("December 12, 2015") |
| Now | Returns the current date and time in your system. | Now()
=Now() |
| Today | Returns a Date value that contains the current date in your system. | Today()
=Today() |
| Day | Returns an Integer value from 1 through 31 that represents the day of the month. | Day(<DateTime>)
=Day(Fields!SaleDate.Value) |
| Hour | Returns an Integer value from 0 through 23 that represents the hour of the day. | Hour(<DateTime>)
=Hour(Fields!SaleDate.Value) |
| Minute | Returns an Integer value from 0 through 59 that represents the minute of the hour. | Minute(<DateTime>)
=Minute(Fields!SaleDate.Value) |
| Month | Returns an Integer value from 0 through 12 that represents the month of the year. | Month(<DateTime>)
=Month(Fields!SaleDate.Value) |
| MonthName | Returns the name of the month specified in the date as a String. | MonthName(<Month Number>[,<Abbreviate>])
=MonthName(Fields!SaleDate.Value) |
| Second | Returns an Integer value from 0 through 59 that represents the second of the minute. | Second(<DateTime>)
=Second(Fields!SaleDate.Value) |
| TimeSerial | Returns a Date value that represents a specified hour, minute, and second, with the date information set relative to January 1 of the year 0001. | TimeSerial(<Hour Number>, <Minute Number>, <Second Number>)
=TimeSerial(DatePart("h", Fields!SaleDate.Value), DatePart("n", Fields!SaleDate.Value), DatePart("s", Fields!SalesDate.Value)) |
| TimeValue | Returns a Date value that contains the information on time represented by a string, with the date set to January 1 of the year 0001. | TimeValue(<StringTime>)
=TimeValue("15:25:45"); TimeValue(Fields!SaleDate.Value) |
| TimeOfDay | Returns a Date value containing the current time of day in your system. | TimeOfDay()
= TimeOfDay() |
| Timer | Returns a Double value that represents the number of seconds elapsed since midnight. | Timer()
=Timer() |
| TimeString | Returns the String value that represents the current time of day in your system. | TimeString()
=TimeString() |
| Weekday | Returns an Integer value that contains a number representing the day of the week. | Weekday(<DateTime[,<DayOfWeek>])
=Weekday(Fields!SaleDate.Value,0) |
| WeekdayName | Returns a String value that contains the name of the specified weekday. | WeekdayName(<WeekDay>[,<Abbreviate[, <FirstDayOfWeek>]])
=WeekdayName(3, True, 0); =WeekDayName("w", Fields!SaleDate.Value), True, 0) |
| Year | Returns an Integer value from 1 through 9999 representing the year. | Year(<DateTime>)
=Year(Fields!SaleDate.Value) |
| Quarter | Returns an Integer value from 1 through 4 representing the quarter number. | Quarter(<DateTime>)
=Quarter(Fields!SaleDate.Value) |
| QuarterName | Returns a string value representing the quarter name. | QuarterName(<DateTime>)
=QuarterName(Fields!SaleDate.Value) |
These are all methods and fields from the System.Math class. Please see the msdn Math Class topic for information on overloads for each method.
| Function | Description | Syntax and Example |
|---|---|---|
| Abs | Returns the absolute or positive value of a single-precision floating-point number. | Abs(<Number>)
=Abs(-5.5);=Abs(Fields!YearlyIncome.Value-80000) |
| Acos | Returns the angle whose cosine is the specified number. | Acos(<Number>)
=Acos(.5); =Acos(Fields!Angle.Value) |
| Asin | Returns the angle whose sine is the specified number | Asin(<Number>)
=Asin(.5); =Asin(Fields!Angle.Value) |
| Atan | Returns the angle whose tangent is the specified number. | Atan(<Number>)
=Atan(.5); =Atan(Fields!Angle.Value) |
| Atan2 | Returns the angle whose tangent is the quotient of two specified numbers. | Atan2(<Number1>,<Number2>)
=Atan2(3,7); =Atan2(Fields!CoordinateY.Value,Fields!CoordinateX.Value) |
| BigMul | Returns the multiplication of two 32-bit numbers. | BigMul(<Number1>,<Number2>)
=BigMul(4294967295,-2147483647); =BigMul(Fields!Int32Value.Value, Fields!Int32Value.Value) |
| Ceiling | Returns the smallest integer greater than or equal to the specified double-precision floating-point number. | Ceiling(<Number>)
=Ceiling(98.4331); =Ceiling(Fields!AnnualSales.Value /6) |
| Cos | Returns the smallest integer greater than or equal to the specified double-precision floating-point number. |
Cos(<Number>) =Cos(60) |
| Cosh | Returns the hyperbolic cosine of the specified angle. | Cosh(<Number>)
=Cosh(60) |
| E | Returns the value of E, which is 2.71828182845905. | E
=E*2 |
| Exp | Returns e raised to the specified ^, where is Euler s number. It is the inverse of the Log function. | Exp(<Number>)
=Exp(3); =Exp(Fields!IntegerCounter.Value) |
| Fix | Returns the integer portion of a number. | Fix(<Number>)
=Fix(-7.15); =Fix(Fields!AnnualSales.Value /-5) |
| Floor | Returns the longest integer less than or equal to the specified double-precision floating-point number. | Floor(<Number>)
=Floor(4.67); =Floor(Fields!AnnualSales.Value/ 12) |
| IEEERemainder | Returns the remainder after division of one number by another according to IEEE standards. | IEEERemainder(<Number1>,<Number2>)
=IEEERemainder(9,8) |
| Log | Returns the logarithm of the specified number. | Log(<Number>)
=Log(20.5); =Log(Fields!NunberValue.Value) |
| Log10 | Returns the logarithm of the specified number to the base 10. | Log10(<Number>)
=Log10(20.5); =Log10(Fields!NumberValue.Value) |
| Max | Returns the maximum non-null value from the specified expression. | Max(<Value>)
=Max(Fields!OrderTotal.Value) |
| Min | Returns the minimum non-null value from the specified expression. | Min(<Value>)
=Min(Fields!OrderTotal.Value) |
| PI | Returns the value of PI, which is 3.14159265358979. | PI
=2 * PI * Fields!Radius.Value |
| Pow | Returns one number raised to the ^ of another number. | Pow(<Number1,<Number2>)
=Pow(Fields!Quantity.Value, 2) |
| Round | Returns the round-off of a decimal number to the nearest integer or to the nearest decimal number up to the specified digits. | Round(<Number>)
=Round(12.456); =Round(Fields!AnnualSales.Value / 12.3) |
| Sign | Returns a value indicating the sign of an 8-bit signed integer. | Sign(<Number>)
=Sign(Fields!AnnualSales.Value-60000) |
| Sin | Returns the sine of the specified number. | Sin(<Number>)
=Sin(60) |
| Sinh | Returns the hyperbolic sine of the specified angle. | Sinh(<Number>)
=Sinh(60) |
| Sqrt | Returns the square root of the specified number. | Sqrt(<Number>)
=Sqrt(121) |
| Tan | Returns the tangent of the specified number. | Tan(<Number>)
=Tan(60) |
| Tanh | Returns the hyperbolic tangent of the specified angle. | Tanh(<Number>)
=Tanh(60) |
These are all methods from the Information class in Visual Basic. Please see the msdn Information Class topic for information on overloads for each method.
| Function | Description | Syntax and Example |
|---|---|---|
| IsArray | Returns True if the expression can be evaluated as an array. | IsArray(<Expression>)
=IsArray(Parameters!Initials.Value) |
| IsDate | Returns True if the expression represents a valid Date value. | IsDate(<Expression>)
=IsDate(Fields!BirthDate.Value); =IsDate("31/12/2010") |
| IsDBNull | Returns True if the expression evaluates to a null. | IsDBNull(<Expression>)
=IsDBNull(Fields!MonthlySales.Value) |
| IsError | Returns True if the expression evaluates to an error. | IsError(<Expression>)
=IsError(Fields!AnnualSales.Value = 80000) |
| Isnothing | Returns True if the expression evaluates to nothing. | IsNothing(<Expression>)
=IsNothing(Fields!MiddleInitial.Value) |
| IsNumeric | Returns True if the expression can be evaluated as a number. | IsNumeric(<Expression>)
=IsNumeric(Fields!AnnualSales.Value) |
These are all methods from the Interaction class in Visual Basic. Please see the msdn Interaction Class topic for more information.
| Function | Description | Syntax and Example |
|---|---|---|
| Choose | Returns a value from a list of arguments. | Choose(<Index>,<Value>[, <Value2>,...[, <Value N>]])
=Choose(3, "10", "15", "20", "25") |
| IIF | Returns the value if the expression evaluates to True, and the second value if the expression evaluates to False. | IIF(<Condition>, <TruePart>, <FalsePart>)
=IIF(Fields!AnnualSales.Value >= 80000, "Above Average", "Below Average") |
| Partition | Returns a string (in the form x : y) that represents the calculated range based on the specified interval containing the specified number. | Partition(<Value>, <Start>, <End>, <Interval>)
=Partition(1999, 1980, 2000, 10) |
| Switch | Returns the value of the first expression that evaluates to True among a list of expressions. | Switch(<Condition1>, <Value1>[, <Condition2>, <Value2>,...[,<ConditionN>, <ValueN>]])
=Switch(Fields!FirstName.Value = "Abraham", "Adria", Fields!FirstName.Value = "Charelotte", "Cherrie") |
You can use aggregate functions within report control value expressions to accrue data. For all of the functions, you can add an optional <Scope> parameter.
These are all the available aggregate functions:
These are all methods from the Convert class in the .NET Framework. Please see the msdn Convert Class topic for more information.
| Function | Description | Syntax and Example |
|---|---|---|
| ToBoolean | Converts the specified value to Boolean. | ToBoolean(<Value>)
=ToBoolean(Fields!HouseOwnerFlag.Value) |
| ToByte | Converts the specified value to Byte. | ToByte(<Value>)
=ToByte(Fields!ProductNumber.Value) |
| ToDateTime | Converts the specified value to a Date and Time value. | ToDateTime(<Value>)
=ToDateTime(Fields!SaleDate.Value); =ToDateTime("1 January, 2017") |
| ToDouble | Converts the specified value to Double. | ToDouble(<Value>)
=ToDouble(Fields!AnnualSales.Value); =ToDouble(535.85 * .2691 * 67483) |
| ToInt16 | Converts the specified value to a 16-bit signed Integer. | ToInt16(<Value>)
=ToInt16(Fields!AnnualSales.Value); =ToInt16(535.85) |
| ToInt32 | Converts the specified value to a 32-bit signed Integer. | ToInt32(<Value>)
=ToInt32(Fields!AnnualSales.Value) |
| ToInt64 | Converts the specified value to a 64-bit signed Integer. | ToInt64(<Value>)
=ToInt64(Fields!AnnualSales.Value) |
| ToSingle | Converts the specified value to a single-precision floating-point number. | ToSingle(<Value>)
=ToSingle(Fields!AnnualSales.Value); =ToSingle(15.857692134) |
| ToUInt16 | Converts the specified value to a 16-bit unsigned Integer. | ToUInt16(<Value>)
=ToUInt16(Fields!AnnualSales.Value) |
| ToUInt32 | Converts the specified value to a 32-bit unsigned Integer. | ToUInt32(<Value>)
=ToUInt32(Fields!AnnualSales.Value) |
| ToUInt64 | Converts the specified value to a 64-bit unsigned Integer. | ToUInt64(<Value>)
=ToUInt64(Fields!AnnualSales.Value) |
The Report Designer also offers several functions which do not aggregate data, but which you can use with an IIf function to help determine which data to display or how to display it.
| Function | Description | Syntax and Example |
|---|---|---|
| InScope | Determines whether the current value is in the indicated scope. | InScope(<Scope>)
=InScope("Order") |
| Level | Returns the level of the current value in a recursive hierarchy. | Level()
=Level() |
| Previous | Returns the previous value within the indicated scope. | Previous(<Value>)
=Previous(Fields!OrderID.Value) |
| RowNumber | Shows a running count of all the rows in the scope returned by the expression. | RowNumber()
=RowNumber() |
| GetFields | Returns an IDictionary<string,Field> object that contains the current contents of the Fields collection. Only valid when used within a data region. This function makes it easier to write code that deals with complex conditionals. To write the equivalent function without GetFields() would require passing each of the queried field values into the method which could be prohibitive when dealing with many fields. | GetFields() =Code.DisplayAccountID(GetFields()) |
| Lookup | Returns the first matching value for the specified name from the dataset with pairs of name and value. | Lookup(<SourceExpression>, <DestinationExpression>, <ResultExpression>, <LookupDataset>)
=Lookup(Fields!ProductID.Value, Fields!ProductID.Value, Fields!Quantity.Value, "DataSet2") |
| LookupSet | Returns multiple row values from a specified dataset and can be used for the 1-to-many relationship. | LookupSet(source_expression, destination_expression, result_expression, dataset)
=LookupSet(Fields!CategoryID.Value, Fields!CategoryID.Value, Fields!UnitsInStock.Value, "Products") |
| MapPoint | Allows displaying simple data directly on the Map as a map Point Layer. | MapPoint(<Latitude>, <Longitude>)
=MapPoint(Fields!Latitude.Value, Fields!Longitude.Value) |
| GroupIndex | Returns the index of the element in the current group. | =GroupIndex() |
| GroupIndex (with scope) | Returns the index of the element in the specified group. | =GroupIndex(<Group>) |
All functions have a Scope parameter which determines the grouping, data region, or dataset to be considered when calculating the aggregate or other function. Within a data region, the Scope parameter's default value is the innermost grouping to which the report control belongs. Alternately, you can specify the name of another grouping, dataset, or data region, or you can specify Nothing, which sets it to the outermost data region to which the report control belongs.
The Scope parameter must be a data region, grouping, or dataset that directly or indirectly contains the report control using the function in its expression. If the report control is outside of a data region, the Scope parameter refers to a dataset. If there is only one dataset in the report, you can omit the Scope parameter. If there are multiple datasets, you must specify which one to use to avoid ambiguity.