|
Getting Started |
Debug Window |
|
|
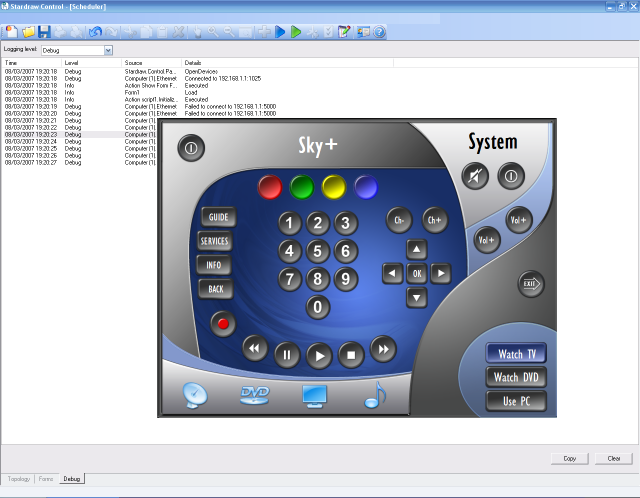
The Debug Window is where run-time diagnostic information is gathered from your project and displayed. To display the Debug Window click the Debug tab in the lower left corner of the Stardraw Control IDE Integrated Design Environment for building and testing Stardraw Control programs..
During your project's development you will be testing how the application interacts with the devices it is connected to. The Debug Window displays activity, status and error information when your project executable is launched from the Stardraw Control IDE.
The Debug Window
It displays various levels of messages and activity in real-time as your project is running. Every mouse click, device event and control command is displayed, so you can see exactly how your application is working, and whether your devices are responding correctly.
For each message is displayed the date/time it occurred, the Logging Level, the message's Source (i.e. the device, port, action or control that generated the message) and the Message.
The Debug Windows displays event messages from devices, ports, actions and controls. Messages fall into five levels of detail:
|
Logging Level |
Description |
|
Fatal |
A catastrophic event that causes your application to terminate. |
|
Error |
An event or state that failed its expected operation or behavior. |
|
Warn |
Indication of a state or event that may cause the application to operate incorrectly. |
|
Info |
Information messages in response to general user or device activity. |
|
Debug |
Low level detailed diagnostic information. This is the default Logging Level. |
During a debug session, messages may be filtered to a specified level using the Logging Level option at the top left of the Debug Window. The Debug Window only displays messages for the selected Logging Level and above.
For instance, a Logging Level of Warn will display only Warn, Error and Fatal messages.
Some types of devices and controls can generate a large number of event messages. To process these, the Stardraw Control IDE consumes more processor and memory resources. Use the Logging Level to reduce the level of detail in the debug session.
Tips
Selecting Off in the Logging Level option stops the debugger from displaying any messages.
Click the Copy button to copy the current message list to the Windows clipboard. You can clear the message list at any time by clicking the Clear button at the bottom right of the Debug Window.